
The LAT released Performance Stats up to mid-year 7 which is current through to the end of September 2022. Together with the LAT’s last update we can now provide a comparison of year over year, with projections through to the end of year 7 in this annual update. What difference did a year make?.
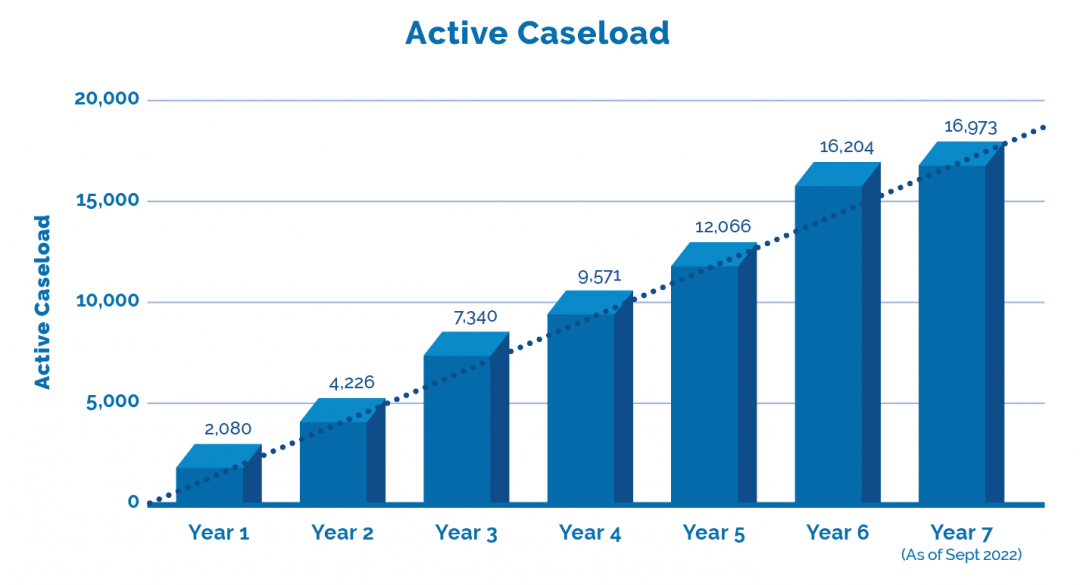
As a point of reference, one year ago, midway through year 6, the active caseload was 14,004. We forecast that would rise to 16,245, a year over year increase of 35% by the end of year 6. In actuality, the end of year 6 case load was 16,204, depicting a fair degree of confidence in projecting the following year.
One wild card being the concerted effort on the part of the LAT to bring staffing levels up. This could enhance productivity, however, as is the case with all things LAT, this very much remains to be seen.

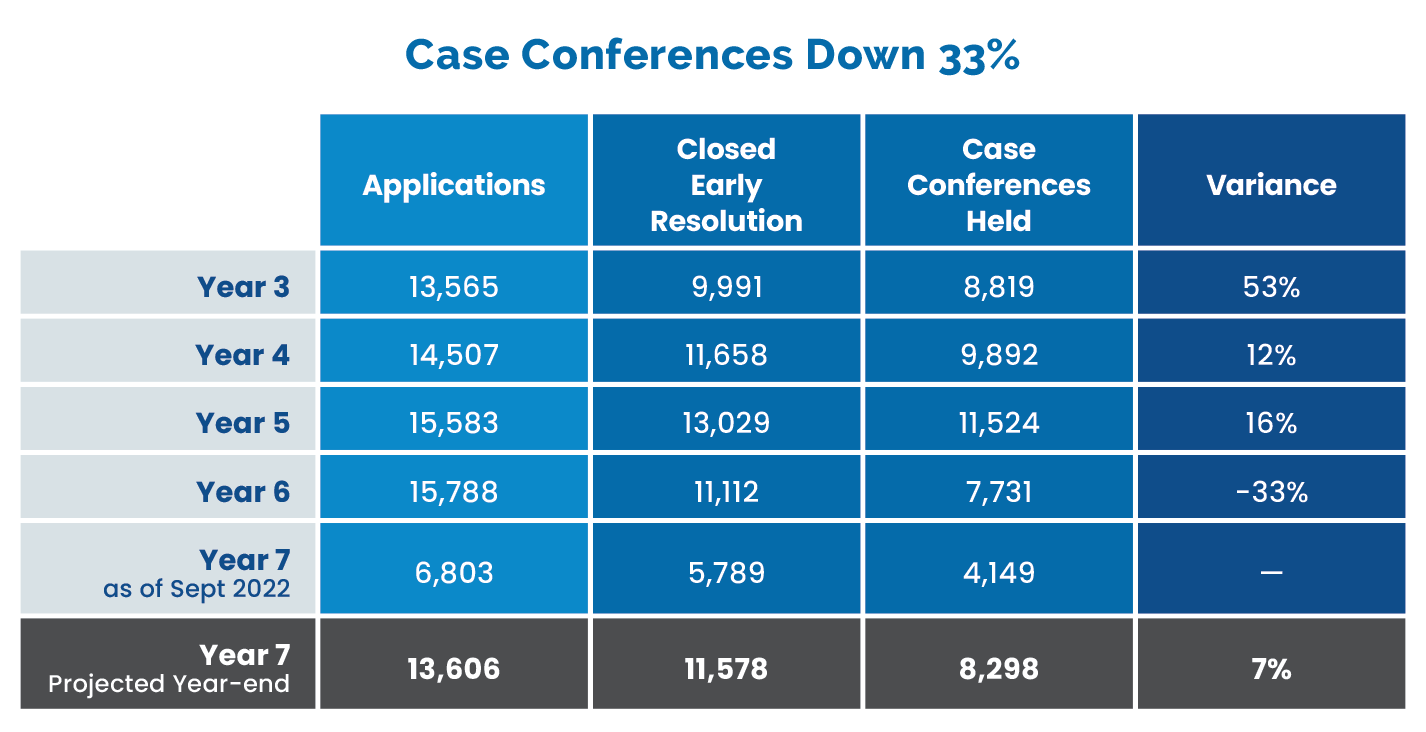
CASE CONFERENCES DOWN 33%
Accounting for the dramatic increase in active caseload during year 6 may well have been the significant decrease in case conferences held. This decreased by 33% as compared to Y5, almost mirroring the increase in active caseload. This was foreshadowed in our annual review February 2022 “Justice Denied” as at that point, midway through Y6, case conferences decreased by 40% as compared to prior year.
This understandably compromises what is an opportunity for resolution between the parties. And this was already compromised by what seems an established practice of cancelling case conferences shortly before the date set, with the subsequent date moving 6+ months further into the future, further eroding the applicant’s five year “window” to claim benefits.
More Hearings Less Decisions
Another puzzling aspect of the year 6 results related to the deterioration in the number of hearings to the decisions issued. In comparing hearings held year 5 (343) to year 6 (491), there was a year over year increase of 43%. However, year 6 the LAT reports a decrease in decisions issued of 16% from 660 in year 5 to 556 in year 6.
Whereas hearings held signals a significant productivity increase, there appears to have been no corresponding impact on providing the party’s the decisions they require to move forward.
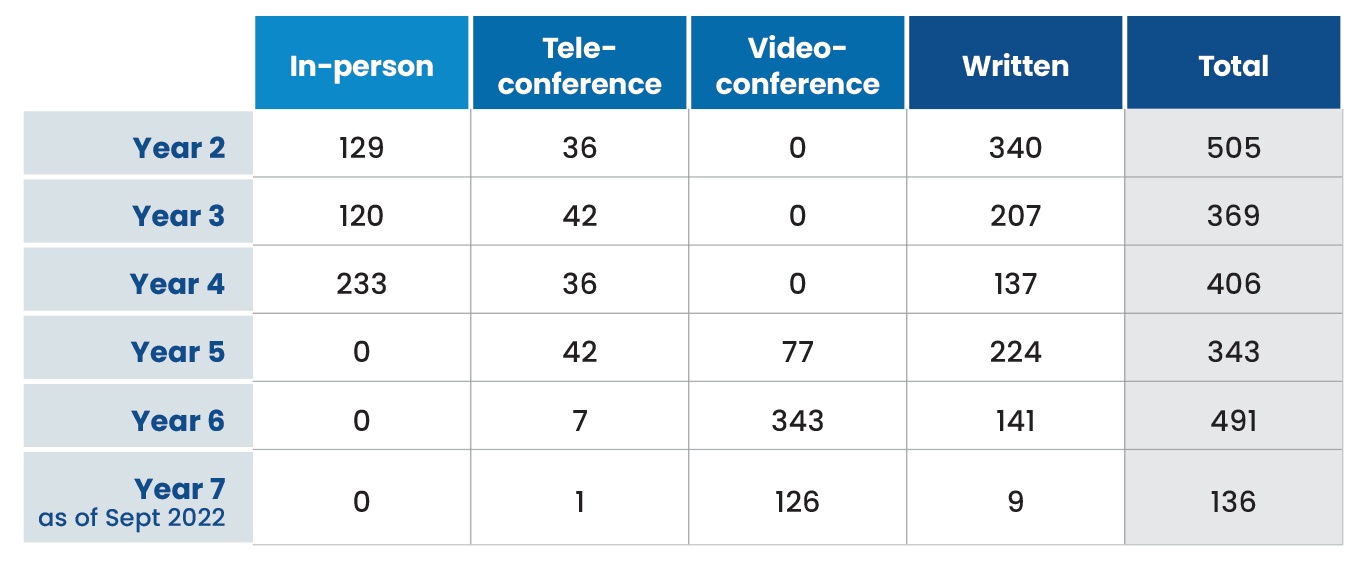
Shift in ‘Hearing’ Format
This may well be directly a result of what appears to have been a marked shift in the hearing format. In year 5, 65% of all reported hearing were in written format, as contrasted with year 6 where a mere 28.7% were written format, fully 71.3% via videoconference. The only year in which written hearings were less than 50% of all hearings was year 4, at 33.7.
Further, the trend seems to be accelerating, as at the midpoint of year 7, only 6.4% were written format. While there may be select complexity issues in play, it has to be queried why there has been such a sudden shift and whether that serves the goal of timely and proportional justice, and how this bodes on a going forward basis.
‘Files in’ versus ‘Files out’
The disposition rate, simply a matter of applications versus files closed, anything less that 100% equates to an increase in active caseload. Midway through year 6, the disposition rate had deteriorated to 75.9%, representing a 15% decrease as compared to year 5. Now that we have the complete year 6 picture, this deteriorated further to 74%. Such a dramatic deterioration in “files in” versus “files out” portrayed best by the 35% increase in active caseload year over year.
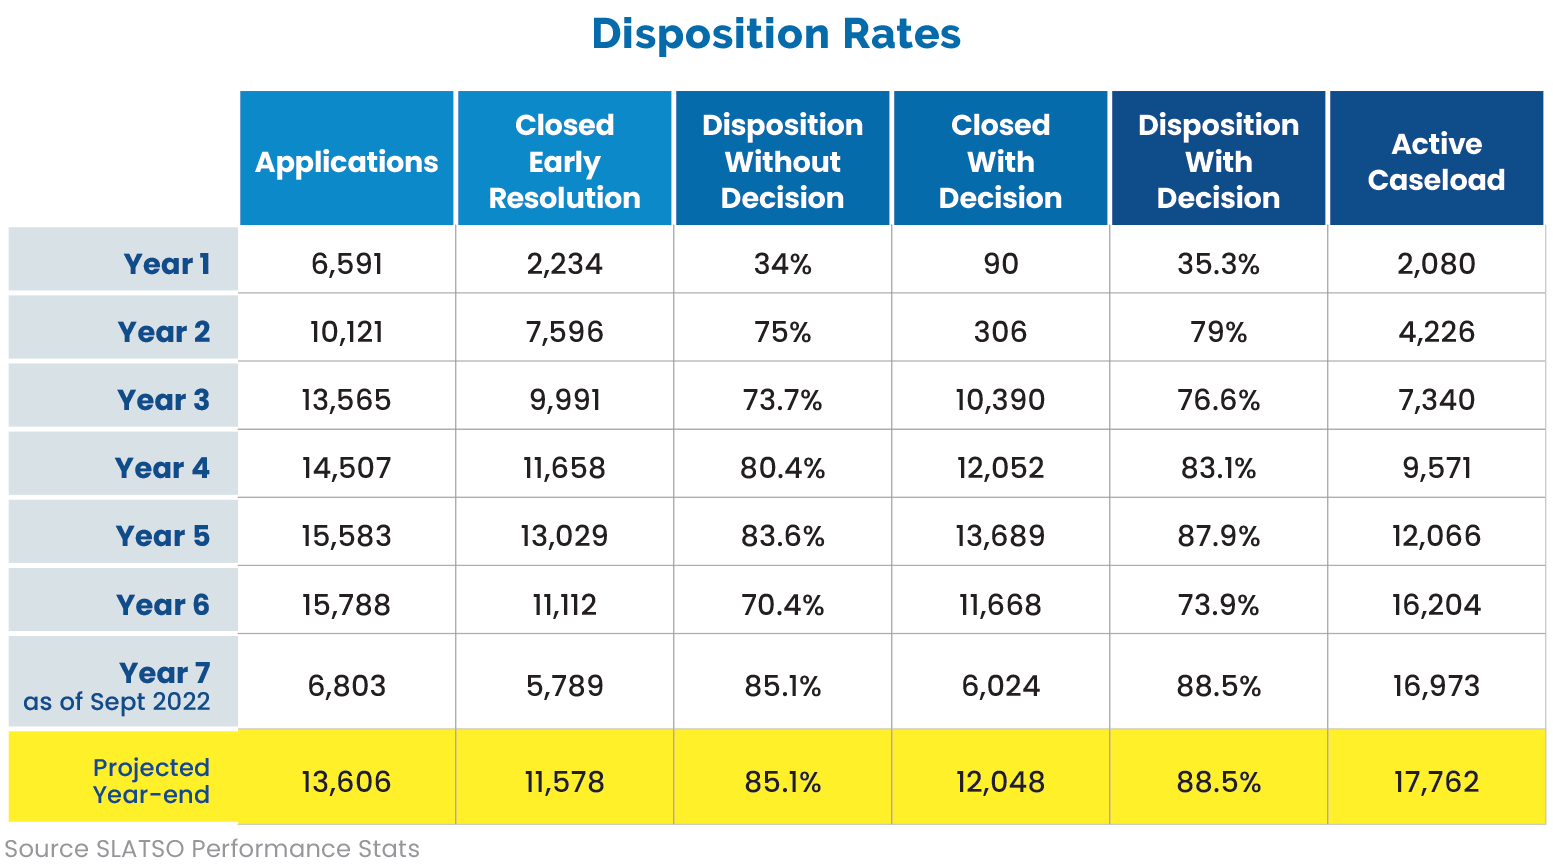
That now brings us to an overview in terms of the performance year to date by the LAT at the midway point of year 7. It is fair to say that there has indeed been a level of improvement across most metrics.
Applications received are trending down, projected through to year end to result in a 13.8% decrease. In addition, overall closure activity is trending at a (modest) 3.3% increase. Taken together, were these trends to continue through to year end 7, despite noted improvement, the active caseload would increase by a further 9.5%.
There has been a significant increase in the disposition rate, from 73.9% in year 6 to 88.5% by the end of September 2022. However, this still falls well short of the minimally required 100%, resulting in the active caseload to continuing to trend upwards.
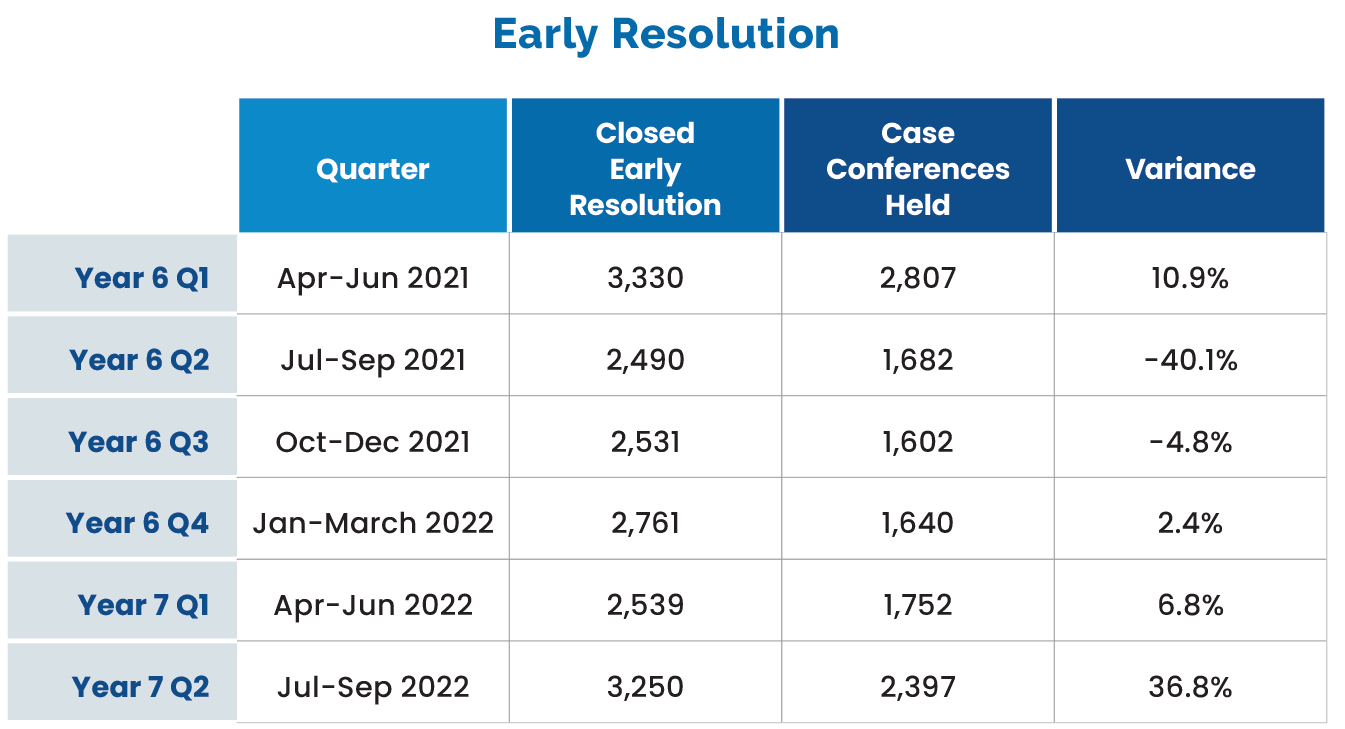
One potentially key metric to watch is the case conferences held. It was evident that the decrease in case conferences had a significant impact on the files closed by early resolution in year 6. With an increase in Q1/2 in year 7 of 36.8%, the total of 2,397 being the highest over the past four quarters, and at least approaching the average numbers that we began to see back in year 3.
It still remains to be seen if the increased staffing levels together with the
increase in case conferences will serve to further improve these key metrics.